Trump’s account of the economy is a story of rescue and revival. For the people living in it, the test is more immediate: the price of groceries, the next mortgage payment and whether a job will last. The charts below follow what he inherited, what changed and where his claims run ahead of the numbers.
Rates, growth and prices meet the final campaign week.
The Federal Reserve’s October 27–28, 2026, meeting was followed on October 29 by the first estimate of third-quarter GDP and September’s Personal Income and Outlays release, including PCE inflation. The reports below follow those decisions and figures through to the household budget in the final days before the November 3 election.
01 · Start before the victory lap
The economy did not begin on inauguration day.
Trump inherited a country already carrying the effects of a pandemic, an inflation surge and higher borrowing costs. The baseline matters because it tells us what was already there before he began taking credit—or assigning blame.
The starting date can do a great deal of political work. Begin at a low point and a recovery looks like a transformation; begin after a price surge and the earlier damage disappears. These charts use December 2016 and December 2024 as the inherited baselines for Trump’s two terms, so the comparison begins before he took office.
From there, the story moves from markets and borrowing to prices and work. Those measures can move in different directions. A rising share index offers little reassurance to someone whose rent has climbed faster than their pay; lower inflation does not return yesterday’s prices. Keeping those distinctions in view makes the political claims easier to judge.
02 · Money and markets
A market rally is not a household budget.
The stock market supplies a ready-made success story. The cost of borrowing tells another one: what it takes to finance a home, keep a business running or carry a balance.
Read these first two charts together. The Nasdaq shows the price of shares in a technology-heavy index. The federal funds series shows the monthly effective rate in the banking system. Neither is a direct measure of what a family can afford. The Federal Reserve sets monetary policy; a presidential demand for cheaper money is not a rate decision.
Interest rates
All presidencies · Comparing Trump’s second term · Event markers on
Follow the borrowing backdrop, then compare it with the position inherited at the start of the term.
3.63 %
Latest series observation (all dates): Aug 1, 2026
Inherited · 2024-12-014.48 %Change to 2026-08-01-0.85 percentage points
Effective federal funds rate: monthly average, not the target range or mortgage rate. Federal Reserve decisions are independent of the presidency.
All presidencies · Comparing Trump’s second term · Event markers on
Follow the market’s fortunes without treating shareholders’ gains as a rise in everyone’s living standards.
26,523 index
Latest series observation (all dates): Sep 18, 2026 · trading close
Inherited · 2024-12-3119,311 indexChange to 2026-09-18+37.35 %
Last available trading close each month; the current month is partial. Technology-heavy price index, not the entire market or a dividend-reinvested return. Source: Nasdaq via FRED.
Congressional Democrats estimate that Americans spent an extra $101.4 billion on gasoline after the Iran war began—about $856 per household. Their October 26 update uses price data through October 14 and national and state fuel-consumption figures.
The same report tracks the growth of Trump’s oil and gas investments. His portfolio and a family’s gas bill tell different stories about the same energy shock.
October 30 · Wages
The paycheck is bigger. It buys less.
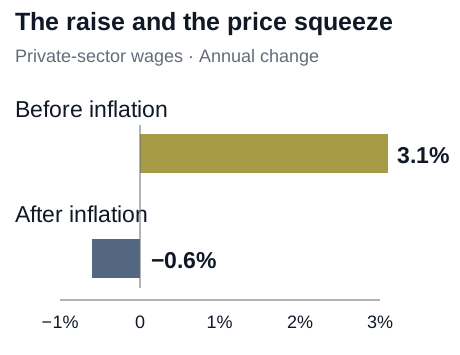
A raise can disappear at the checkout. Private-sector wages rose 3.1% over the year through September, according to the BLS Employment Cost Index. After inflation, purchasing power fell 0.6%. The final pre-election wage release gives a sharper picture of the squeeze behind the campaign’s economic claims.
The figures arrive four days before the election, following September’s fall in real disposable income. A stronger national growth figure has not ended the pressure on household budgets.
Private-sector wages · Year through September 2026 · BLS Employment Cost Index. Source figures November 1 updateThe next bills are health insurance and farm fuel.
The pressure on purchasing power extends into the new enrollment season and the farm economy. The Public Health account follows rising ACA premiums and the people losing coverage; the tariff investigation examines the rescue promises made to farmers facing expensive fuel and disrupted trade. These are the costs behind the campaign’s promises of relief.
November 2 updateFactories are busier. The inputs are still expensive.
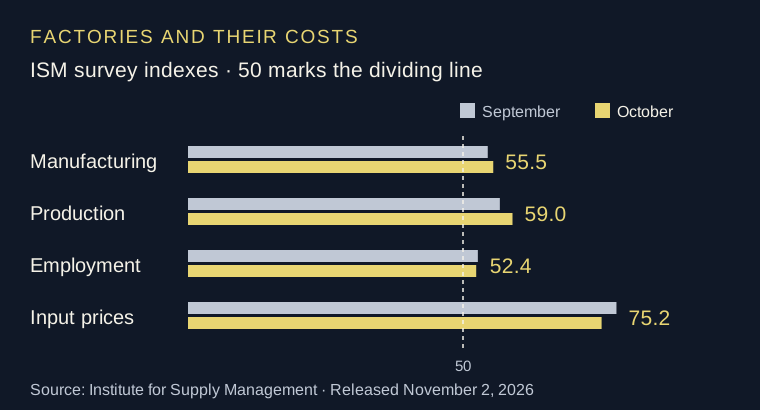
The October ISM manufacturing index rose to 55.5, with production at 59.0 and employment at 52.4. The prices index eased to 75.2 but still showed widespread increases. Manufacturers named tariffs and the Middle East conflict among the forces pushing up costs.
The indexes measure the direction and breadth of change, with 50 as the dividing line. A prices reading of 75.2 means increases are widespread; it does not measure the size of those increases.
ISM · October 2026, released November 2. Index points; the dashed line marks 50.
October 30 · Energy profits
The oil shock is paying the refiners.
Exxon and Chevron beat quarterly earnings expectations as disruption from the Iran war and the conflict in Ukraine lifted refining profits. Exxon’s refining earnings exceeded its production earnings for the first time in at least six years, Reuters reports. Chevron’s downstream business had its strongest quarter over the same period.
Higher fuel costs drain household budgets. Inside the oil companies, the same disruption is feeding a surge in refining income. The earnings reports put the distribution of the war’s economic costs in plain view.
October 29 · Growth, prices and income
A growing economy can still leave a household squeezed.
The economy expanded at a 3.4% annualized pace in the third quarter. That is faster than the second quarter’s 2.2%. Five days before the vote, Trump has a stronger growth number to put on the campaign stage.
September’s household figures tell the other part of the story. Inflation-adjusted disposable income fell 0.3% and real spending barely moved. PCE prices were 3.6% higher than a year earlier; the measure excluding food and energy rose 3.1%. Growth has not removed the pressure on purchasing power.
October 28 · Federal Reserve
The election gets no rate-cut reprieve.
The Fed held its benchmark range at 3.75%–4% on October 28. The vote was 10–2; the dissenters, Lisa Cook and Beth Hammack, wanted a quarter-point increase. Inflation remained elevated in the central bank’s assessment.
For Trump, there is no pre-election rate cut to fold into his economic pitch. For borrowers, the pressures documented below remain: expensive housing credit, fuel costs and a household budget stretched long before the campaign reached its final week.
October 27 · New reporting
The price at the pump will be there on election day.
The campaign has one account of the economy. The gas station has another. EIA’s October 27 release puts the national average for regular gasoline at $4.269 a gallon, down 1.5 cents over the week but $1.234 above its price a year earlier. Diesel is $6.352, up 7.6 cents in a week and $2.634 over a year.
Diesel’s price follows goods through the economy: trucks, deliveries, farming and the businesses that move supplies. A small weekly fall in gasoline does not undo the much larger increase families have absorbed.
The national fuel bill EIA · U.S. averages, October 26, 2026
Regular gasoline$4.269per gallon+$1.234 from a year earlier
Diesel$6.352per gallon+$2.634 from a year earlier
Released October 27. Gasoline fell 1.5 cents over the week; diesel rose 7.6 cents. EIA price series
The figures arrive seven days before the midterms, as Trump campaigns on his economic record and his administration discusses tariff relief with Canada. Read them alongside the earlier congressional estimate of the war’s additional gasoline cost and the president’s oil-stock holdings.
03 · The shopping basket
Slower inflation does not undo the price rise.
This is where a reassuring headline can collide with the checkout. Prices can keep climbing even while the rate of inflation falls.
The price-level chart asks how expensive the basket has become. The inflation chart asks how fast it is changing. Read the first for the accumulated pressure, the second for its pace. A slower rise is welcome; it does not return groceries, rent or other bills to their earlier level.
Watch the level and the rate together. A falling inflation line can sit beside a price index that is still going up.
October 23, 2026 · The household squeeze
The bills are still winning.
Trump is heading into the midterms with households still struggling to see the prosperity he keeps promising. The University of Michigan’s final October consumer-sentiment index came in at 48.0, barely changed from September’s 48.1. Buying conditions for big-ticket household goods fell 18% as borrowing costs and affordability worried consumers.
People expect prices to rise 4.7% over the next year and 3.5% over the longer run. Both readings rose for a second month.
A separate Michigan report traces the renewed inflation fears through two policy shocks: the 2025 tariff escalation and the energy-price surge during the Iran war. It warns that repeated shocks risk making higher inflation feel permanent. The political damage is immediate; the economic consequences could outlast this election.
Businesses, meanwhile, are still expanding. S&P Global’s preliminary October composite activity index was 57.6. Its survey also found selling-price increases at their fastest since August 2022, Dow Jones reported. Strong activity is giving companies room to pass rising costs on to customers.
All presidencies · Comparing Trump’s second term · Event markers on
Look at the accumulated climb: this is the level of prices, not the inflation rate.
334.1 index
Latest series observation (all dates): Aug 1, 2026
Inherited · 2024-12-01317.6 indexChange to 2026-08-01+5.20 %
CPI-U, seasonally adjusted, 1982–84 = 100. Tracks an urban consumer basket, not every household’s cost of living. Falling inflation does not mean falling prices.
The test is whether people can find and keep work.
Jobs and unemployment bring the story closer to the paycheck. They also measure different things, so one headline cannot stand in for the whole labor market.
Payrolls count jobs on employers’ books. Unemployment measures people in the labor force who are out of work and looking. Read them alongside each other: growth in the total number of jobs and the share of people unable to find one reveal different pressures. Revisions belong to that record too; later information can change the picture first presented on release day.
Unemployment
All presidencies · Comparing Trump’s second term · Event markers on
Follow the share of people looking for work who cannot find it.
4.1 %
Latest series observation (all dates): Aug 1, 2026
Inherited · 2024-12-014.1 %Change to 2026-08-010.00 percentage points
Seasonally adjusted share of the civilian labor force unemployed and seeking work. People outside the labor force are excluded.
When the numbers are unwelcome, the messenger becomes a target.
The public needs statistics that survive a bad news day. That makes the treatment of the people producing them part of the economic story.
Trump’s dismissal of BLS commissioner Erika McEntarfer after the August 2025 jobs release placed the agency itself in the political firing line. The later funding lapse caused a different kind of damage: the collection of prices stopped, leaving a missing October CPI observation. One episode attacked the institution’s leadership; the other interrupted its work.
A missing observation is part of the story. Filling it with a smooth line would conceal what the shutdown took away.
Events that help explain the chart
1. 2020-03 · COVID pandemic. WHO characterized COVID-19 as a pandemic on March 11, 2020. Illness, restrictions, behavioral changes and fiscal support affected activity. Source ↗
2. 2022-02 · Ukraine invasion. Russia’s invasion disrupted energy and commodity markets. The March Federal Reserve statement described inflation pressure and uncertainty. Source ↗
3. 2022-03 · Fed rate rises. The Fed began raising its target range in March 2022. Monetary policy, supply conditions and demand interact; this marker does not quantify causation. Source ↗
4. 2025-10 · Record government shutdown. The 42-full-day government-wide shutdown stopped BLS price collection from October 1 through November 12. October CPI could not be reconstructed and was never published, which is why the Trump-era CPI lines contain a genuine gap. Source ↗
Presidents influence fiscal and regulatory policy alongside Congress. Interest rates, global shocks, inherited trends, private investment and delayed effects also matter. Different term lengths make raw cumulative changes unsuitable as a league table. Gaps in the charts mark missing observations.
WHEN THE NUMBERS WENT DARK
The gap is part of Trump’s shutdown record
The break in the red CPI line is not a chart fault. The Bureau of Labor Statistics collected no prices from October 1 through November 12, 2025, during what became the longest government-wide shutdown in US history. October’s observation could not be recreated and was never published.